0- Suivi de la recommandation
Since January 2018, supplier ENGIE Grand Public has replaced the “Cap EcoConso” tool with “Ma conso”, which factors in the nature of the meter readings (actual or estimated): :
- on the graph of the “Ma conso” page in the customer area (on the web),
- For the billing meter readings, in the bill received by post or downloadable from the page “My Bills” page in the customer area.
A screen tip pops up showing the type of reading (see below)..
A few points about the graph: it states whether the meter reading is “actual” (stemming from the distributor), “estimated” (distributor or supplier), or “customer” (self-read).
Customers who have a smart meter need to display the detailed view of the graph than hover over its meter readings.
At the end of 2018, supplier ENGIE Gaz Tarif Réglementé modified the “Cap EcoConso” tool, specifying in particular whether usage is based on the actual or estimated reading. Furthermore, supplier ENGIE Gaz Tarif Réglementé has enhanced the “Cap EcoConso” tool, which has since been renamed to “Activ ’conso”. Users of the “Cap EcoConso” service are informed by e-mailing that their usage data has been automatically migrated to the new tool. The nature of the reading on which usage is based is specified in the graphs :
- actual reading (Gazpar meter),
- actual, customer or estimated reading (electromechanical/mechanical meter).
1- Observation
On receipt of his electricity bill, the claimant was surprised by the amount, questioning the reading when the meter was removed and replaced with an electric meter in August 2017. A claim was then filed with distributor ENEDIS, which confirmed the August 2017 reading with photos of the removed meter.
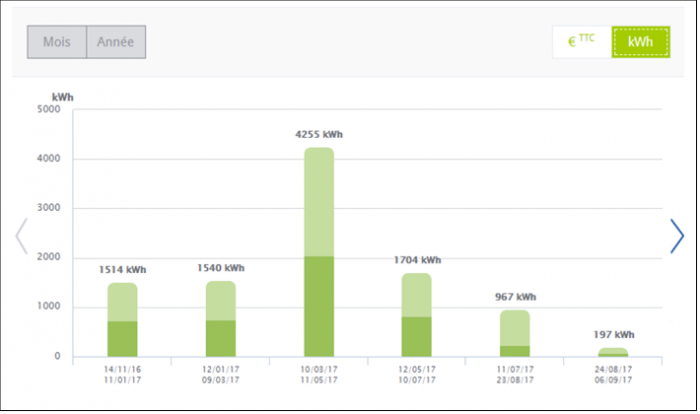
The claimant mentioned a possible malfunction of his electricity meter. Indeed, according to his online statement in the Cap EcoConso tool (see the graph below), his usage totalled 4,255 kWh for the period from 10 March 2017 to 11 May 2017, whereas in the periods from 14 November 2016 to 11 January 2017 then from 12 January 2017 to 9 March 2017 his usage totalled respectively 1,514 kWh and 1,540 kWh.
The claimant therefore questioned why his usage had risen so much in spring, a period when his heating is no longer on. He speculated that there was a problem with his electricity meter, which would explain this abnormal usage.